
Cost of Living in the USVI: Power, Water and Housing
Living in the USVI is costly in several ways: WAPA's posted residential power rates top 40 cents per kWh, and consumer prices rose 7.1 percent in 2024, over twice the U.S. rate, by the territory's own index. Census rents and incomes help you budget by island.
MovingBy USVI Realty Editorial TeamUpdated October 29, 20269 minute read

Photo: LittleT889, CC BY 4.0
USVI Realty is an educational resource. This guide puts official figures on everyday costs in the U.S. Virgin Islands: electricity, water, groceries, fuel and housing. We use the Water and Power Authority (WAPA), the U.S. Census Bureau, the U.S. Department of Housing and Urban Development (HUD), the Department of Licensing and Consumer Affairs (DLCA), the Bureau of Economic Research (BER) in the Office of the Governor and other official sources, never auto-generated cost-of-living sites. Every figure is dated. Prices change, so check current numbers before you commit to a move, a lease or a purchase.
Is it expensive to live in the USVI?
By the territory’s own measure, prices have risen faster than on the mainland. BER’s consumer price index rose 7.1 percent in 2024, after 8.4 percent in 2023. The U.S. rate, from the Bureau of Labor Statistics, was 2.9 percent, and BER called the territory’s rate “over twice the national level.” BER said the slowdown that began in June 2024 was likely due to a modest decline in fuel prices and improving economic conditions, which helped offset global supply chain problems, and that these factors significantly influence costs in the territory.
Housing carries the most weight in BER’s index, at 41.9 percent, followed by food at 13.2 percent.
Estimate as of October 2026. BER’s 2024 review measured inflation of 9.6 percent on St. Thomas, 5.8 percent on St. John and 5.3 percent on St. Croix. These are 2024 figures.
Why is electricity so expensive?
WAPA supplies electricity across the territory and posts one set of rates for all three islands. A residential bill has an energy charge, which covers WAPA’s non-fuel costs, a fuel charge called the Levelized Energy Adjustment Clause (LEAC), three small surcharges and a flat customer charge.
Fuel is the main driver. WAPA says about 76 percent of its budget goes to fuel, which is “highly susceptible to wide market fluctuations,” and that fuel costs are passed on to customers through the LEAC. WAPA does not set the LEAC itself: it petitions the Public Services Commission, which holds a public hearing before deciding.
Estimate as of October 2026. WAPA’s most recent posted rate breakdown, as of March 1, 2022, lists the residential charges below, plus a flat customer charge of $4.86. A separate WAPA page still lists rates effective February 1, 2020 (40.03 and 42.65 cents per kWh), so check a current bill or ask WAPA.
| Residential electricity, March 1, 2022 | First 250 kWh a month | Each kWh after that |
|---|---|---|
| Energy charge | 18.15 cents | 20.77 cents |
| Fuel charge (LEAC) | 22.22 cents | 22.22 cents |
| PILOT, self-insurance and OPEB surcharges | 0.48 cents | 0.48 cents |
| Total per kWh | 40.85 cents | 43.47 cents |
The fuel charge can move. WAPA’s LEAC page posts its filings with the Public Services Commission.
Estimate as of October 2026. In a filing titled Emergency Review October 2026, WAPA proposed raising the fuel charge from 22.2246 to 25.2246 cents per kWh for October to December 2026. Its worksheets assume a 25 percent rise in the delivered price of No. 2 oil, to $4.61 a gallon, and put the increase at $12 a month for a home using 400 kWh. The filing shows the July to September 2026 fuel charge at 22.2246 cents, the same as in the 2022 breakdown. It is marked a preliminary draft subject to material change.
BER’s 2024 review also found electricity prices up 6.9 percent from 2023. Before you sign a lease or make an offer, ask for 12 months of WAPA bills. Our guide to moving to the USVI explains how to open an account, and our utilities directory covers the services to set up. If you are weighing solar panels or a generator, start with our solar and generators directory.
What does water cost?
Homes get water from WAPA’s pipes, from a cistern that collects rain from the roof, from a water truck, or from a mix of these. WAPA says it distributes drinking water to almost 13,000 customers through water lines and standpipes.
| 2020 Census, share of housing units | St. Thomas | St. Croix | St. John |
|---|---|---|---|
| Cistern, catchment, tanks or drums | 72.6% | 70.1% | 85.2% |
| Public system | 37.8% | 42.1% | 20.5% |
| Water truck or delivery vendor | 18.3% | 7.6% | 20.6% |
A home can report more than one source.
Estimate as of October 2026. WAPA’s water rate calculator, effective August 1, 2023, lists residential water at $18.56 per 1,000 gallons for the first 1,000 gallons and $21.05 per 1,000 gallons after that, plus a fuel surcharge of $9.532 and a line loss reduction surcharge of $0.71 per 1,000 gallons. That makes the first 1,000 gallons $28.80. It also lists a rate for water haulers of $17.93 per 1,000 gallons plus the fuel surcharge.
The hauler rate is what haulers pay WAPA, not what they charge for a delivery, so ask haulers for their delivered price. Our cistern and water services directory is a place to start.
Cistern water has its own costs. A January 2024 guide posted by the Department of Planning and Natural Resources (DPNR) recommends inspecting a cistern for structural damage quarterly and cleaning and disinfecting it every three to five years at a minimum, and after extreme storms. It treats routine water testing as the owner’s cost. It also suggests an emergency supply of about 1 gallon per person per day, ideally for two weeks and at least for three days.
How much do groceries and fuel cost?
BER found food prices up 8.8 percent across the territory in 2024, after 7.7 percent in 2023. By island, its food index rose 10.2 percent on St. Thomas, 8.9 percent on St. Croix and 7.1 percent on St. John.
Estimate as of October 2026. These are BER’s average prices for all islands combined, the mean of prices it collects each month for its 2024 review.
| Item | 2023 average | 2024 average |
|---|---|---|
| Eggs, per dozen | $12.16 | $14.49 |
| Meats, per pound | $9.06 | $9.74 |
| Chicken, per pound | $8.59 | $8.40 |
| Fish, per pound | $7.70 | $10.26 |
| Fruits, per pound | $5.70 | $5.96 |
| Vegetables, per pound | $3.74 | $3.97 |
For more recent prices by island, DLCA surveys supermarkets and gas stations and posts the results on its news and surveys page.
Estimate as of October 2026. DLCA’s supermarket comparison for the week of August 24, 2026 found these lowest prices for identical items on each island. DLCA compares a different number of items on each island (97 on St. Croix, 86 on St. Thomas and 51 on St. John), so its basket totals are not comparable between islands.
| Lowest price found, week of Aug. 24, 2026 | St. Thomas | St. Croix | St. John |
|---|---|---|---|
| White rice, 5 lb | $5.29 | $4.49 | $7.95 |
| All-purpose flour, 5 lb | $4.99 | $6.79 | $10.39 |
| Whole milk, half gallon | $3.00 | $3.69 | $4.59 |
| Chicken breast, per lb | $3.99 | $4.99 | $3.95 |
| Bananas, per lb | $1.09 | $0.89 | $1.95 |
| White bread, 24 oz | $5.69 | $5.69 | $4.99 |
No island was cheapest for everything. Fuel is a different story.
Estimate as of October 2026. DLCA’s most recent posted fuel survey, for the week of September 7, 2026, found the average self-service prices below. It also listed propane at $24 to $25 for a 20-pound tank and $99 to $99.50 for 100 pounds on St. Thomas, and $22 to $24 and $94 to $97 on St. Croix.
| Average price per gallon, week of Sept. 7, 2026 | St. Thomas | St. Croix | St. John |
|---|---|---|---|
| Regular gasoline | $5.261 | $4.327 | $5.539 |
| Premium gasoline | $5.837 | $4.607 | $5.739 |
| Diesel | $6.936 | $5.404 | $6.422 |
What does housing cost?
The most complete comparison by island is still the 2020 Census. Gross rent is the contract rent plus the estimated cost of utilities and fuels the renter pays. Owner costs add up mortgage payments, real estate taxes, insurance, utilities and fuels, plus condominium fees where they apply.
Estimate as of October 2026. Figures are from the 2020 Census, and incomes are for 2019. They are not today’s rents or prices.
| 2020 Census | St. Thomas | St. Croix | St. John | Territory |
|---|---|---|---|---|
| Median gross rent, monthly | $960 | $822 | $1,283 | $926 |
| Renters paying 35% or more of income on rent | 40.2% | 29.0% | 43.3% | 36.0% |
| Median owner costs, with a mortgage | $1,930 | $1,461 | $2,525 | $1,730 |
| Median owner costs, no mortgage | $415 | $309 | $412 | $351 |
| Median household income | $40,464 | $39,445 | $50,352 | $40,408 |
HUD’s Fair Market Rents are a more recent official yardstick. HUD describes them as estimates of 40th percentile gross rents for standard-quality units and uses them in programs such as Housing Choice Vouchers. They are not the asking rent for any home.
Estimate as of October 2026. HUD’s Fair Market Rents for fiscal year 2027, in effect for the islands from October 1, 2026, are below.
| HUD Fair Market Rent, FY 2027 | St. Thomas | St. Croix | St. John |
|---|---|---|---|
| Studio | $1,054 | $1,029 | $1,607 |
| One bedroom | $1,223 | $1,035 | $1,617 |
| Two bedrooms | $1,509 | $1,237 | $2,025 |
| Three bedrooms | $1,809 | $1,497 | $2,413 |
BER’s price survey gives another territory-wide view of rents.
Estimate as of October 2026. BER’s 2024 review reported average rents of $1,820.50 a month for a one-bedroom unit and $2,392.69 for a two-bedroom unit, all islands combined, up 5.2 and 20.6 percent from 2023. These are BER’s averages, not the asking rent for any particular home.
For more on renting, see long-term rentals in the USVI. Buying? Read USVI home prices, property taxes in the USVI and our guide to hurricane and flood insurance.
Which island is cheapest to live on?
By the measures we can source, St. Croix. It had the lowest median gross rent and the lowest median owner costs in the 2020 Census, and HUD’s fiscal year 2027 Fair Market Rents are lowest there for every unit size shown. In DLCA’s September 2026 survey, regular gasoline averaged about 93 cents a gallon less on St. Croix than on St. Thomas. BER also measured the slowest 2024 inflation on St. Croix, at 5.3 percent.
Groceries are mixed: in DLCA’s August 2026 comparison, St. Croix, St. Thomas and St. John each had the lowest price on some identical items. St. John had the highest median rent, the highest HUD rents and the highest owner costs for homes with a mortgage, along with the highest median household income. WAPA posts one set of power and water rates for the whole territory, so the rates do not change by island, though each home’s use does.
To weigh cost against everything else, read which USVI island is right for you and our guides to living in St. Thomas, St. Croix and St. John.

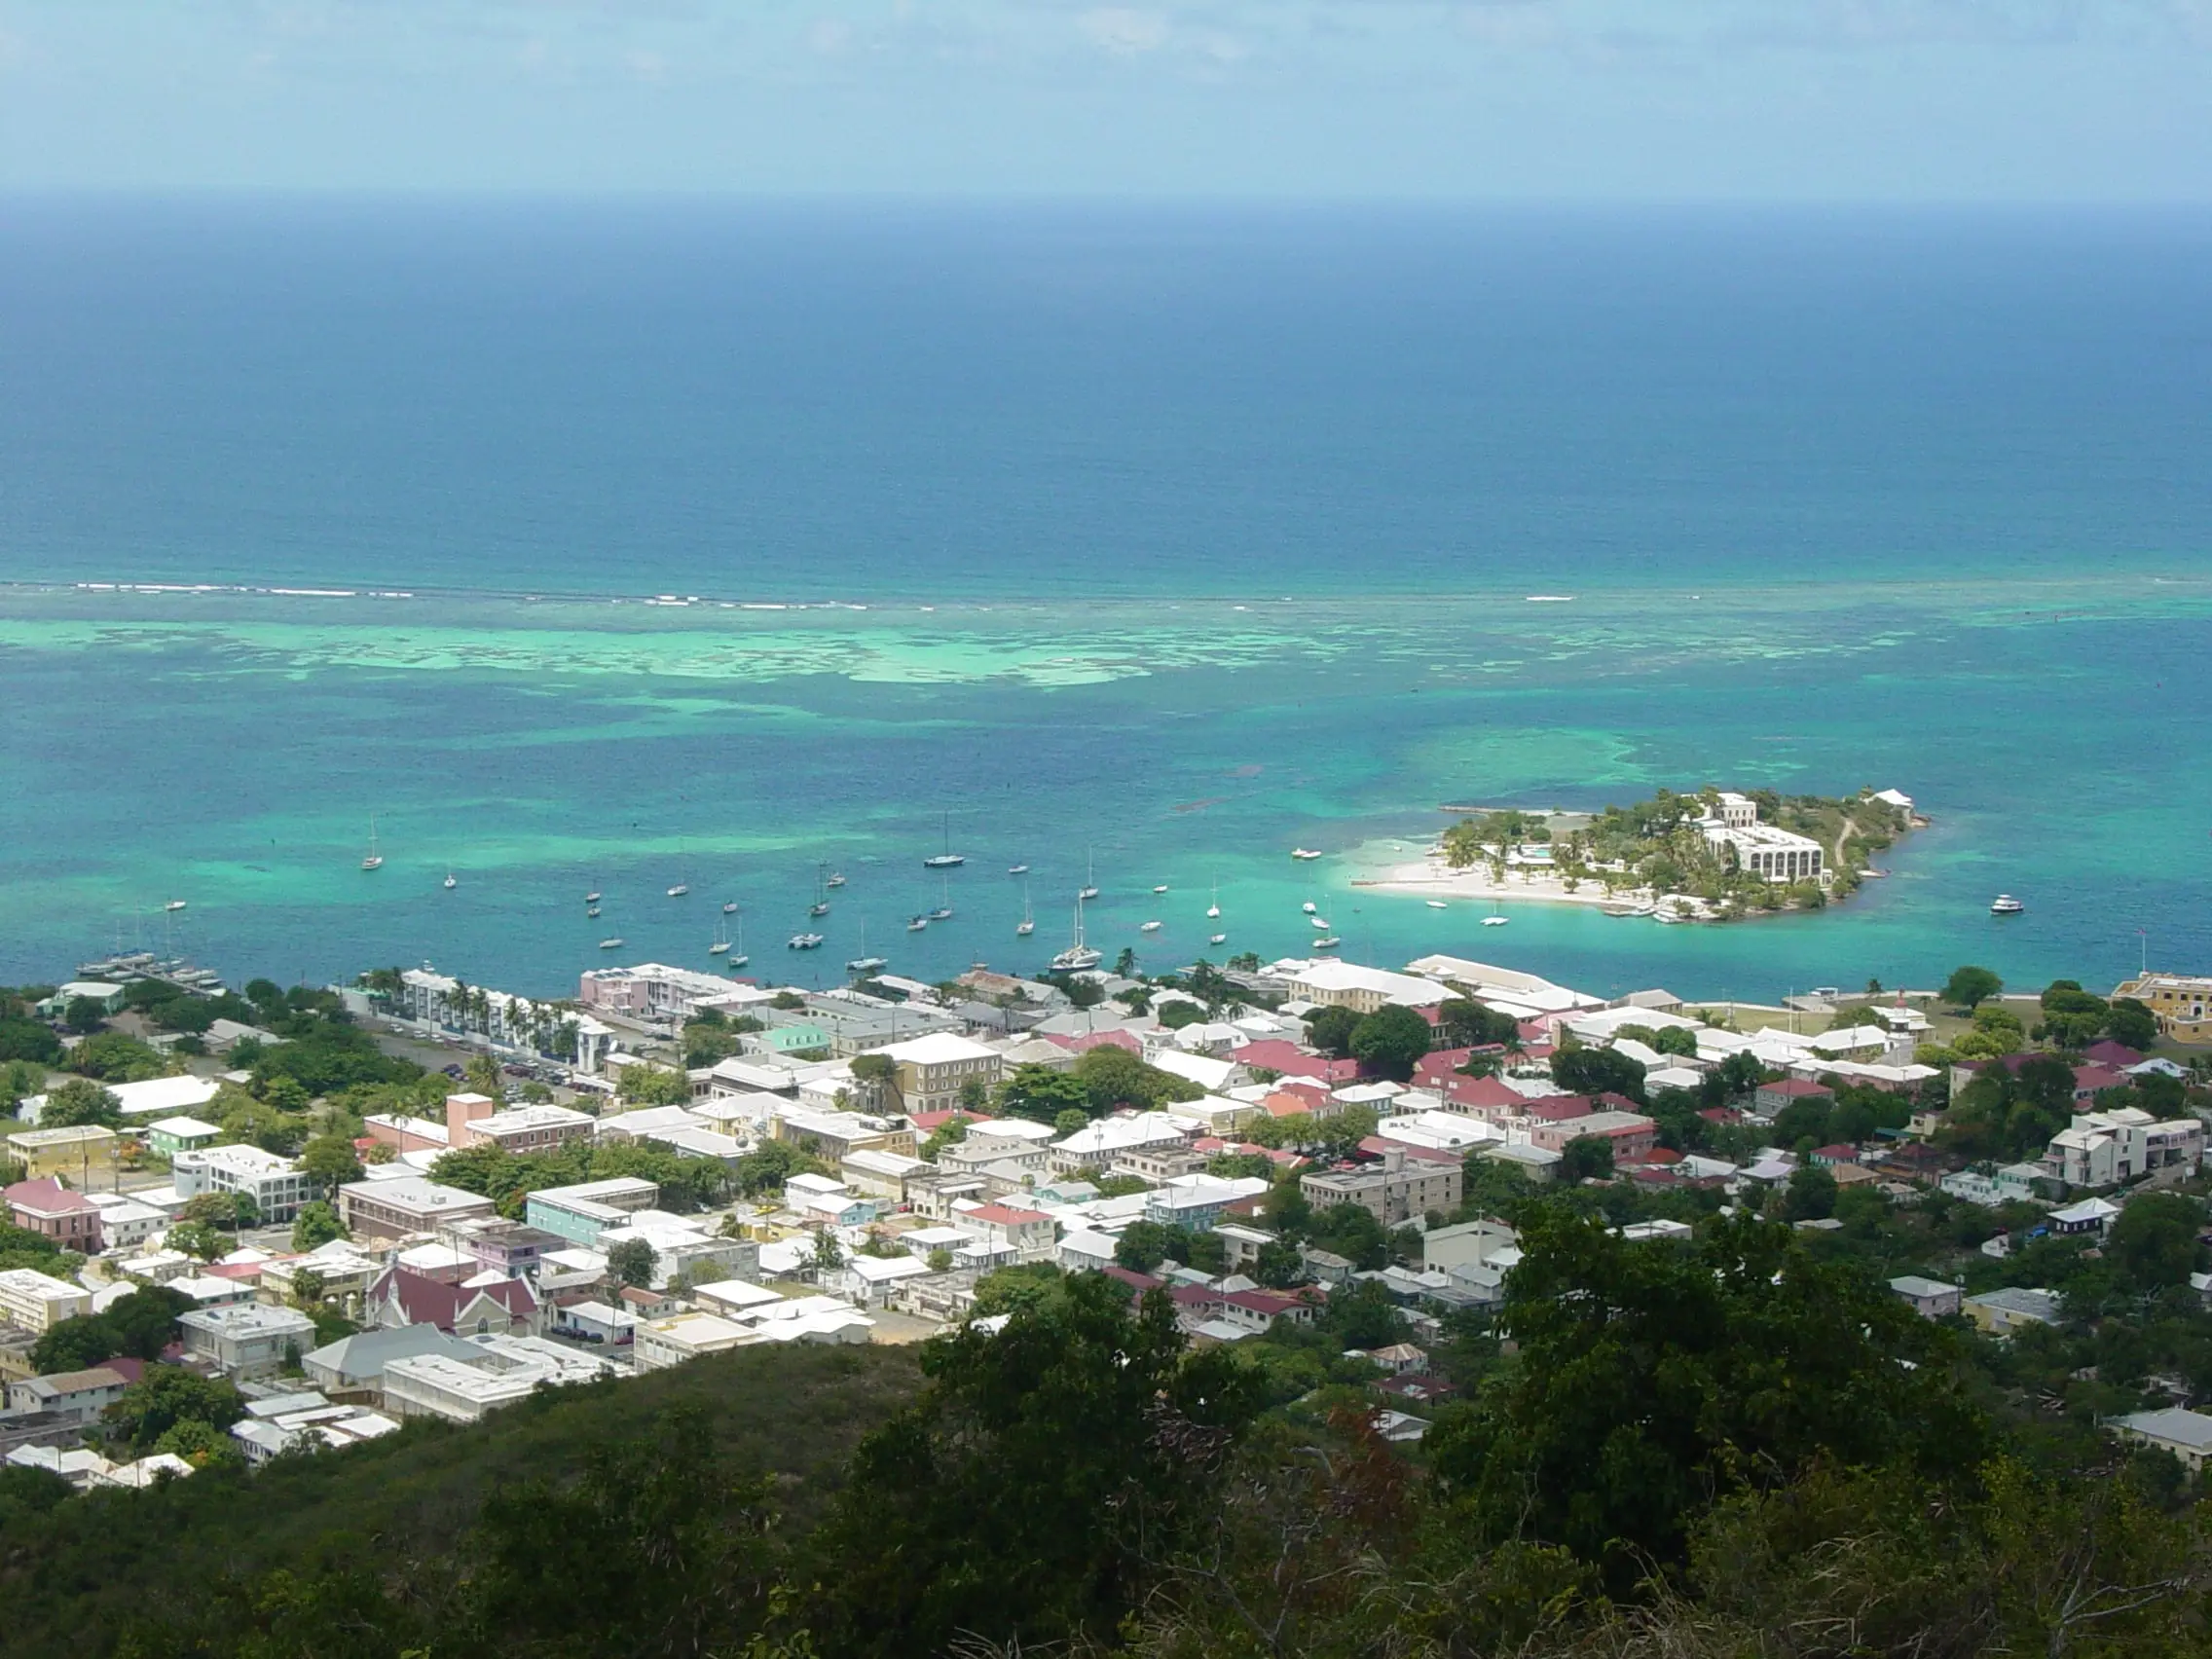
Photo: Jason P. Heym, CC BY-SA 3.0

Photo: Navin75, CC BY-SA 2.0
Questions
Is it expensive to live in the USVI?
In several ways, yes. The Bureau of Economic Research measured consumer price inflation of 7.1 percent in 2024, more than twice the U.S. rate, and WAPA's posted residential electric rates are above 40 cents per kWh. For context, the 2020 Census put the territory's median household income for 2019 at $40,408.
Why is electricity so expensive?
WAPA says about 76 percent of its budget goes to fuel, and fuel costs are passed on to customers through a charge called the LEAC, which the Public Services Commission sets after a public hearing. In WAPA's March 2022 rate breakdown, that fuel charge was 22.22 cents of a residential rate of about 41 to 43 cents per kWh. For October to December 2026, a preliminary WAPA filing proposed raising the fuel charge by 3 cents per kWh.
How much do groceries cost?
The Bureau of Economic Research's 2024 average prices included $14.49 for a dozen eggs, $8.40 a pound for chicken and $3.97 a pound for vegetables, and its food price index rose 8.8 percent that year. For recent prices by island, the Department of Licensing and Consumer Affairs posts supermarket comparisons. Prices change quickly, so treat these as a guide to the level, not a quote.
Which island is cheapest to live on?
By the measures we can source, St. Croix. It had the lowest median gross rent in the 2020 Census, the lowest HUD Fair Market Rents for fiscal year 2027 and the lowest average gasoline prices in DLCA's September 2026 survey. Grocery prices were mixed, and WAPA posts the same power and water rates for the whole territory.
Sources
- Electric Rate, Virgin Islands Water and Power Authority (accessed October 29, 2026). Page dated as of March 1, 2022; explains the energy charge, surcharges and LEAC
- Electric Rates Breakdown: As of March 1, 2022, Virgin Islands Water and Power Authority (accessed October 29, 2026)
- Kilowatt Per Hour Rate, Virgin Islands Water and Power Authority (accessed October 29, 2026). Rates listed as effective February 1, 2020
- What is the LEAC, Virgin Islands Water and Power Authority (accessed October 29, 2026)
- LEAC Adjustment Petition, Virgin Islands Water and Power Authority (accessed October 29, 2026)
- WAPA Electric LEAC Model, Emergency Review October 2026, Virgin Islands Water and Power Authority (accessed October 29, 2026). Preliminary draft dated September 15, 2026, marked subject to material change
- Water Rate, Virgin Islands Water and Power Authority (accessed October 29, 2026). Page dated as of July 15, 2023
- Water Rate Calculator (August 2023), Virgin Islands Water and Power Authority (accessed October 29, 2026). Spreadsheet listing rates effective August 1, 2023
- About Us, Virgin Islands Water and Power Authority (accessed October 29, 2026). Water customers served through water lines and standpipes
- U.S. Virgin Islands Consumer Price Index: 2024 Inflation Review, Bureau of Economic Research, Office of the Governor (accessed October 29, 2026). Posted May 30, 2025
- DLCA's Fuel Survey Findings for the Week of September 7, 2026, Virgin Islands Department of Licensing and Consumer Affairs (accessed October 29, 2026). Release dated September 14, 2026
- DLCA's Supermarket Comparison Results for the Week of August 24, 2026, Virgin Islands Department of Licensing and Consumer Affairs (accessed October 29, 2026). Release dated August 31, 2026
- DLCA News and Surveys, Virgin Islands Department of Licensing and Consumer Affairs (accessed October 29, 2026). List of posted fuel surveys and supermarket comparisons
- Fair Market Rents (40th Percentile Rents), U.S. Department of Housing and Urban Development (accessed October 29, 2026). Definition, uses and effective dates of Fair Market Rents
- FY 2027 Fair Market Rents: county level data, U.S. Department of Housing and Urban Development (accessed October 29, 2026). Rows for St. Croix, St. John and St. Thomas islands
- Reevaluation Requests for FY 2027 Fair Market Rents, U.S. Department of Housing and Urban Development (accessed October 29, 2026). The Virgin Islands are not among the areas where FY 2026 rents remain in effect
- 2020 Census Demographic Profile, St. Thomas, St. Croix and St. John: Selected Housing Characteristics (DP4), U.S. Census Bureau (accessed October 29, 2026)
- 2020 Census Demographic Profile, U.S. Virgin Islands: Selected Housing Characteristics (DP4), U.S. Census Bureau (accessed October 29, 2026)
- 2020 Census Demographic Profile, St. Thomas, St. Croix and St. John: Selected Economic Characteristics (DP3), U.S. Census Bureau (accessed October 29, 2026)
- 2020 Census Demographic Profile, U.S. Virgin Islands: Selected Economic Characteristics (DP3), U.S. Census Bureau (accessed October 29, 2026)
- 2020 Island Areas Demographic Profile, U.S. Virgin Islands: variable labels, U.S. Census Bureau (accessed October 29, 2026). Labels used to read the DP3 and DP4 table codes.
- 2020 Island Areas Censuses Demographic Profile Summary File: Technical Documentation, U.S. Census Bureau (accessed October 29, 2026). Appendix B definitions of gross rent, selected monthly owner costs and source of water
- Your Health and Cisterns: A USVI Comprehensive Guide, Virgin Islands Department of Planning and Natural Resources (accessed October 29, 2026). Dated January 2024